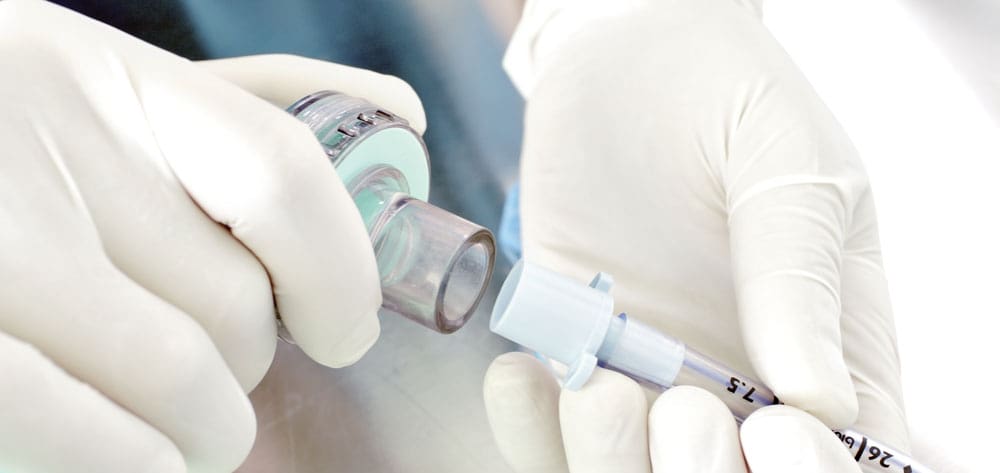
End-tidal carbon dioxide (ETco2) monitoring provides valuable information about CO2 production and clearance (ventilation). Also called capnometry or capnography, this noninvasive technique provides a breath-by-breath analysis and a continuous recording of ventilatory status. In fact, it’s commonly called the “ventilation vital sign.”
By providing instantaneous feedback on the patient’s ventilation effectiveness, ETco2 monitoring gives early warning of respiratory compromise. It also may reflect cardiac perfusion changes and has been used to indicate the effectiveness of chest compressions in cardiac arrest. What’s more, it confirms endotracheal tube placement and helps monitor ventilator circuit integrity.
A standard of care in the operating room for more than 25 years, ETco2 monitoring is becoming a common adjunct in the intensive-care and procedural-care settings. In the prehospital arena, it provides immediate feedback on the patient’s ventilatory status.
Understanding noninvasive ventilation
Continuous-waveform capnography: A crucial tool for ED clinicians
The case for capnography in patients receiving opioids
Wherever ETco2 monitoring is used, it can enhance patient safety—as long as bedside clinicians understand the interplay among ventilation, perfusion, and CO2 production. Although the principles underlying ETco2 monitoring have been known for many years, recent technological advances have made the technique feasible for routine clinical application. To fully optimize its use, clinicians must understand certain basic principles. This article explains these concepts, discusses ETco2 waveforms, and describes the assessment capabilities of this monitoring method. Although ETco2 is used in non-intubated patients, here we focus on its use in patients with endotracheal intubation. Keep in mind that ETco2 findings are interpreted within the context of physical and other traditional assessment methods.
The science behind the technique
CO2 is a byproduct of cellular metabolism. Cells take in oxygen and glucose and release water, carbon dioxide, and energy. CO2 plays an important role in acid–base buffering. Depending on blood pH at any given time, CO2 converts either to carbonic acid (H2CO3, an acid) or to bicarbonate (HCO3-, a base).
CO2 exists in three primary states in the blood: as HCO3– (70%), bound to hemoglobin (20%), and dissolved in the plasma (10%). As HCO3-, CO2 influences blood pH; direct CO2 measurement indicates ventilatory effectiveness. Both pH and CO2 are measured from arterial blood gas (ABG) samples. While ETco2 monitoring doesn’t directly indicate acid-base balance, it can shed light on ventilation efficacy.
CO2 combines with water to create H2CO3, which can degrade to bicarbonate, water, and CO2. This process occurs in red blood cells, where HCO3– is released back into the plasma ready to accept another hydrogen ion (H+), while CO2 and H2O are carried to the arterial-alveolar junction for release into the atmosphere. The lungs serve as a pump to promote the activity of ventilation.
Gas diffusion
Gases diffuse from areas of higher concentrations to areas of lower concentration. In the pulmonary artery, deoxygenated blood has a partial pressure of carbon dioxide (Pco2) of approximately 46 mm Hg and a partial pressure of oxygen (Po2) of roughly 40 mm Hg. As a result, oxygen from the alveolus (where Po2 is about 100 mm Hg) diffuses into the blood, and CO2 diffuses from the blood into the alveolus (where Pco2 measures about 40 mm Hg). Because inspired air has negligible CO2 amounts (less than 0.04%), exhaled CO2 can be monitored and used as a correlate to assess CO2 gas exchange and effective ventilation.
Ventilation/perfusion matching
ETco2 reflects metabolism, circulation, and ventilation. In patients with normal pulmonary function, CO2 (normally 35 to 45 mm Hg) and ETco2 should correlate closely, with a deviation of about 2 to 5 mm Hg. Circulating blood CO2 is slightly greater than exhaled CO2 due to a ventilation-perfusion (.V/Q) mismatch. (Not all alveoli participate in gas exchange at a given time, resulting in some shunting.) In acutely ill patients, especially those on mechanical ventilators, pronounced changes in ventilation and/or perfusion may occur, causing a much greater disparity between arterial and end-tidal values. That’s why it’s important to know the patient’s arterial CO2 baseline, track trends, and correlate ETco2 values with ABG values in the event of sudden or dramatic deviations.
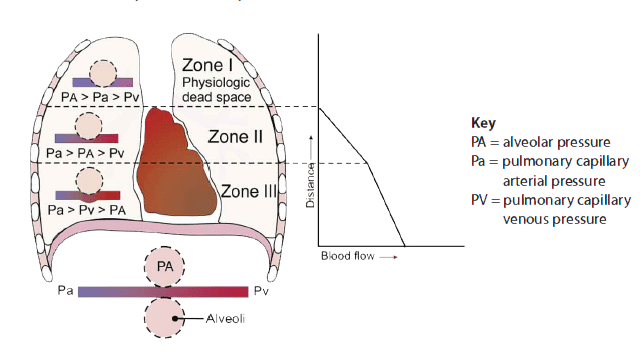
End-tidal clearance must be evaluated in the context of the patient’s perfusion status. Dead-space ventilation results in ventilated alveoli with insufficient perfusion, which leads to low ETco2. This may result from such ventilatory problems as high mean airway pressure or inadequate exhalation time (resulting in overdistention), or from such circulatory problems as shock, massive fluid loss, or pump failure (resulting in hypotension). To visualize ventilation and perfusion, see Lung zones.
CO2 production
Measured CO2 also is influenced by CO2 production. In critically ill patients, CO2 production may increase from such conditions as sepsis, fever, seizures, agitation, and carbohydrate overloading. Because variances may occur over hours, ETco2 values must be trended for clinical application.
Types of ETco2 monitors
Three primary types of ETco2 monitors are available: sidestream, mainstream, and Microstream®. All have evolved to be lighter, more accurate, and easier to calibrate. Each type has certain advantages and limitations.
Sidestream monitors
Sidestream monitors rely on a separate monitor or analyzer connected to the patient’s airway by tubing. Gas samples are aspirated from exhaled gas flow via the ventilator circuit through a T-adapter and are read at the monitor. Sampling rates usually range from 150 to 200 mL/minute, making these monitors unsuitable for neonates. A slight delay in data retrieval may occur due to the lag time between airway and monitor. Sidestream monitors can be used with noninvasive ventilation and are relatively inexpensive when part of a monitoring package.
Mainstream monitors
With these monitors, a sampling window is inserted directly in-line with the ventilator circuit for CO2 measurement. This allows a more rapid response time and requires a smaller amount of sample gas than sidestream monitoring. But mainstream monitors increase mechanical dead space, depending on size of the chamber used to collect a gas sample, while adding weight on the airway. Also, they can’t be used for noninvasive ventilation.
Microstream monitors
While sidestream and mainstream monitors rely on infrared absorption, the newest type of ETco2 monitor uses molecular correlation spectrography for greater precision. The Microstream monitor has a rapid response time and may be used with both invasive and noninvasive ventilation. It’s commonly used in procedural areas, such as gastroenterology labs, where moderate sedation is administered. Its main limitations are cost and the need for a monitor separate from the bedside monitor or ventilator.
Interpreting ETco2 monitoring data
Data obtained from ETco2 monitoring depends on proper equipment function and is only as useful as the clinician’s ability to interpret and apply it. This section discusses ETco2 waveforms and the assessment capabilities of ETco2 monitoring.
ETco2 values may be displayed solely as a numeric value (capnometry) or with a waveform (capnography). Waveforms may be time-based (CO2 over time) or volume-based (CO2 plotted over exhaled tidal volume). A time-based capnogram can provide useful information based on its morphology and phases; it’s commonly used in the clinical arena. (See Basic time-based capnogram)
Basic time-based capnogram
The time-based capnogram, such as the one shown here, is the most common type of
capnogramused in the clinical arena. The expiratory segment is divided into three phases:
Phase I: beginning of exhalation, mainly gas from anatomic dead space containing very little CO2
Phase II: mixing of gas from anatomic dead space with alveolar gas, showing a rapid rise in healthy lungs
Phase III: alveolar plateau with a slight rise to pure alveolar gas; the last 15% of CO2 takes about 50% of total phase-III time

Volume-based (expiratory) capnography yields a waveform with characteristic phases plotted over a known exhaled volume. (See Volume-based capnogram.) The CO2 waveform relative to exhaled tidal volume allows calculation of physiologic dead-space components (alveolar plus anatomic), adding more depth to ETco2 monitoring. To maximize its application, a Paco2 reading should be obtained.
Clinical indices for increased arterial-to-ETco2 gradients
In a state of perfect equilibrium, arterial and end-tidal CO2 levels correlate on a 1:1 basis. But even in an ideal physiologic state, a difference of 2 to 5 mm Hg usually exists. Known as the arterial-to-etco2 gradient, this differential results from small amounts of dead-space ventilation (ventilation without perfusion) and a slight venous admixture.
The arterial-to-ETco2 gradient widens in two basic conditions—increased physiologic dead space (anatomic dead space plus alveolar dead space) and low perfusion states.
- Anatomic dead space measures approximately 150 mL in an adult male and doesn’t change. Alveolar dead space may increase with chronic obstructive pulmonary disease, pulmonary embolism, and positive-pressure ventilation. Simply stated, alveolar pressures exceed perfusion pressure in some areas (such as lung zone I), contributing to decreased CO2 ventilation.
- In low perfusion states, decreased blood passing by the alveoli and lower diffusion across the alveolar-arterial junction lead to exhaled gas with less CO2. Common reasons for decreased perfusion include blood or fluid loss, cardiac pump failure, and profound systemic vasodilation.
When ventilation is effective, ETco2 numbers are higher. When perfusion is poor, ETco2 numbers are lower.
Obtaining and trending the arterial-to-ETco2 gradient can provide valuable assessment data that help identify pulmonary and perfusion disorders. Periodically checking the arterial-to-ETco2 gradient should be a routine part of ETco2 monitoring. It ensures that the monitor is accurately indicating what’s happening in the blood and can provide useful information about changes in compliance, resistance, and ventilatory status. Be aware that equipment malfunction and contamination caused by wetness or leaks in the monitoring system may lead to inaccurate exhaled CO2 measurement.
Waveform analysis
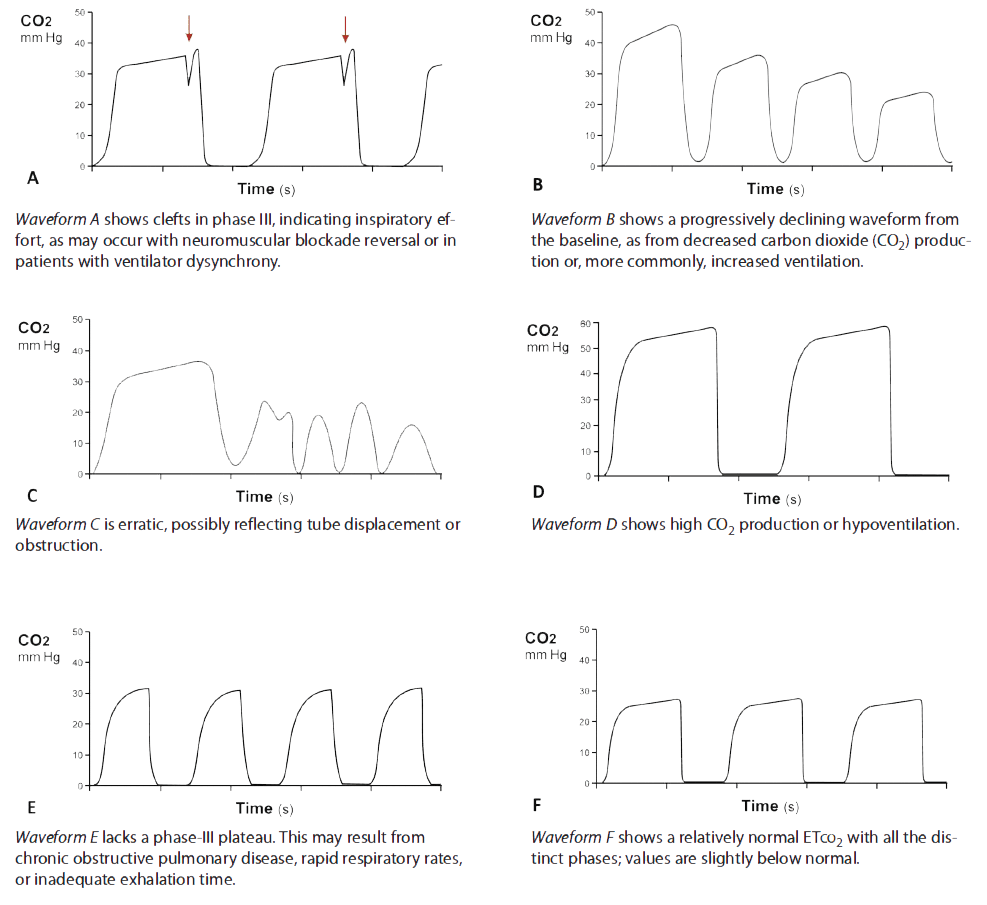
Clinicians’ ability to assess ETco2 waveforms helps distinguish equipment malfunction from changes in the patient’s condition. The waveform should have distinct phases corresponding to exhaled CO2. A change in or loss of these phases may indicate alterations in the monitoring system or the patient’s perfusion status. Of course, waveform monitoring can’t replace the use of sound clinical judgment in assessing a patient’s condition. (See Capnographic states)
Special indications for ETco2 monitoring
In the field, monitoring ETco2 during endotracheal-tube placement can verify correct tube placement and indicate tube dislodgement during transport. During cardiopulmonary resuscitation (CPR), adequate chest compressions generate a cardiac output of 17% to 27%, allowing CO2 circulation for exhalation. ETco2 and coronary artery perfusion pressures have a linear correlation. Thus, ETco2 monitoring is a noninvasive way to measure coronary artery blood flow and return of spontaneous circulation during CPR; evidence suggests a persistently low ETco2 value and a widened Paco2-to-ETco2 gradient during CPR are associated with poor outcomes.
Another use of ETco2 monitoring is during procedural sedation and analgesia (PSA). Respiratory depression and airway obstruction are the primary causes of PSA-related adverse events; ETco2 changes are the earliest indicators of airway compromise.
Researchers continue to explore the use of ETco2 monitoring in such areas as metabolism and perfusion related to ketoacidosis and gastroenteritis, as well as for blind nasal intubation and optimizing endotracheal-cuff filling.
Many settings, many uses
ETco2 monitoring yields significant information about a patient’s ventilation status when combined with thorough physical assessment. It can be used in a wide range of settings, from prehospital settings to emergency departments and procedural areas.
The authors work at the R Adams Cowley Shock Trauma Center at the University of Maryland Medical Center in Baltimore. Mark Bauman is nurse manager of the Trauma Acute Care Unit. Cindy Cosgrove is a senior Clinical Nurse I in the Neurotrauma Critical Care Unit.
References
Brochard L, Martin GS, Blanch L, et al. Clinical review: Respiratory monitoring in the ICU—a consensus of 16. Crit Care. 2012 Apr 36; 16(2):219.
Lah K, Križmari´c M, Grmec S. The dynamic pattern of end-tidal carbon dioxide during cardiopulmonary resuscitation: difference between asphyxial cardiac arrest and ventricular fibrillation/pulseless ventricular tachycardia cardiac arrest. Crit Care. 2011;15(1):R13.
McSwain SD, Hamel DSS, Smith PB, et al. End-tidal and arterial carbon dioxide measurements correlate across all levels of physiologic dead space. Respir Care. 2010 Mar;55(3):288-93.
Porth CM, Matfin G. Pathophysiology: Concepts of Altered Health States. 8th ed. Philadelphia: Lippincott Williams & Wilkins; 2010.
Walsh BL, Crotwell DN, Restrepo RD, (2011) Capnography/Capnometry during mechanical ventilation: 2011. Resp Care. 2011 Apr;56(4):503-9.
West JB, Dollery CT, Naimark A. Distribution of blood flow in isolated lung; relation to vascular and alveolar pressures. J Appl Physiol. 1964 Jul;19:713-24.
Whitaker DK. Time for capnography—everywhere. Anaesthesia. 2011 Jul;66(7):544-9.


2 Comments.
I know what the graph looks like, but have never seen ETCo2 displayed numerically as a in capnometry. Would have been nice to see examples.
Best wishes for you.